![]()
Assignment 2
by
Laura Kimbel
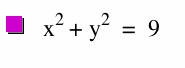
8. Graph
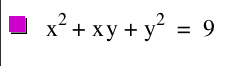
Now, on the same axes, graph
Describe the new graph. Try different coefficients for the xy term. What kinds of graphs do you generate? What coefficients mark the boundaries between the different types of graphs? How do we know these are the boundaries? Describe what happens to the graph when the coefficient of the xy term is close to the boundaries.
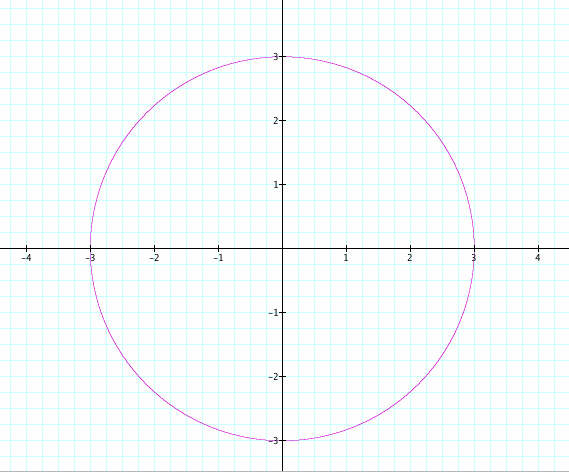
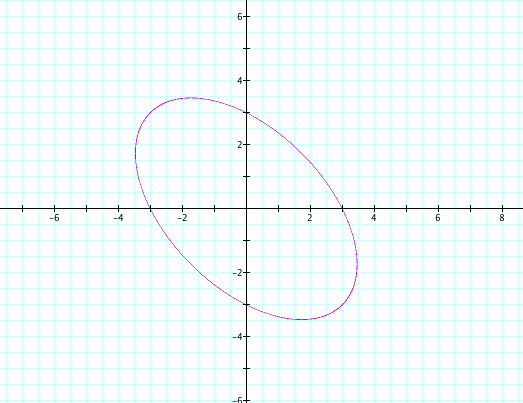
Graphed on the same axes....


The first graph is a circle of radius 3. The second graph depicts what looks like an ellipse that is slanted. We will notice in the next graph what happens when we change the the coefficient of the xy term. We will start with the coefficient being 0, and then proceed to increase it by .25 each time.
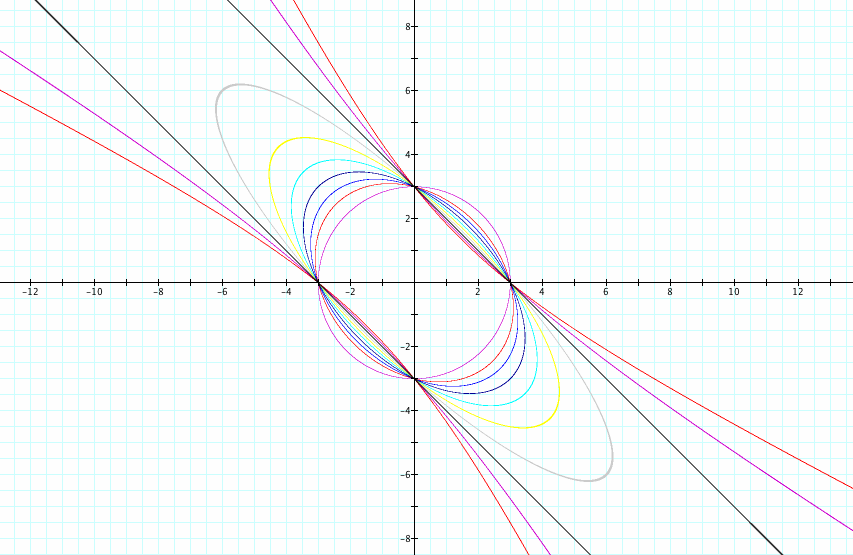
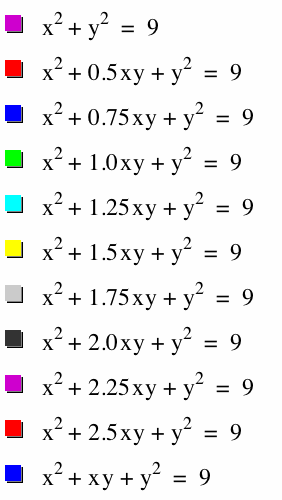
What appears to be happening is our original circle seems to be stretched out diagonally until it reaches a certain threshold in which the two sides of the ellipse actually break apart and begin curving outwardly, away from each other. In the graph above, this happens somewhere between the light grey graph and the dark grey graph. The coefficients of their xy terms are 1.75 and 2.0, respectively. Let's examine an animation of the coefficient of the xy term and see if we can make some conjectures about the boundary of this change in the graph.

Here, we have our xy term ranging from -5 to 5. We can see that when it starts out negative, we have what appears to be a hyperbola slanted to the positive diretion (the slant assymptote is positive in slope). As we get closer to -2, an ellipse then forms. As we approach n=0, we can see our circle. Then as n becomes positive, we now see an ellipse slanted in the opposite direction from before. When it reaches n=2, we again have the jump from an ellipse to a hyperbola. Let's see if we can figure out why this happens.
If you recall, the general form for a Conic Section is
![]()
In our equation above, we have A = 1, C = 1, F = -9, and B is what we are investigating.
In Conic Sections, we can learn a lot from the coefficients of our general form. For example, when B = D = E = 0, and A = C, we have a circle. Also, when B = D = E = 0 and A is not equal to C, we have an ellipse. We can also have an ellipse when B is not equal to 0, as we have seen above, and it is this xy term that introduces a slant to our graph. In addition to our ellipse, we have seen above that this xy term can also produce a hyperbola. A concept that can provide us with a little more insight is the DISCRIMINANT:
![]()
When
![]()
it produces an ellipse. When
![]()
it produces a parabola. And when
![]()
it produces a hyperbola.
In our problem above, we have A = C = 1. This should give us some insight into the boundary between a hyperbola and an ellipse.
What is the value of B in order for us to have an ellipse?

What is the value of B in order for us to have a hyperbola?

Now that we have gained some more insight into this graph, we can go back to the animation and see if this appears to be true.